Difference between revisions of "PRO Graphs"
From meteoplug
(Created page with "<languages /><translate> __NOTOC__ <br />One of the features that sets Meteobridge PRO and NANO SD apart from the regular Meteobridges is the ability to generate interactive...") |
(No difference)
|
Revision as of 23:12, 18 August 2019
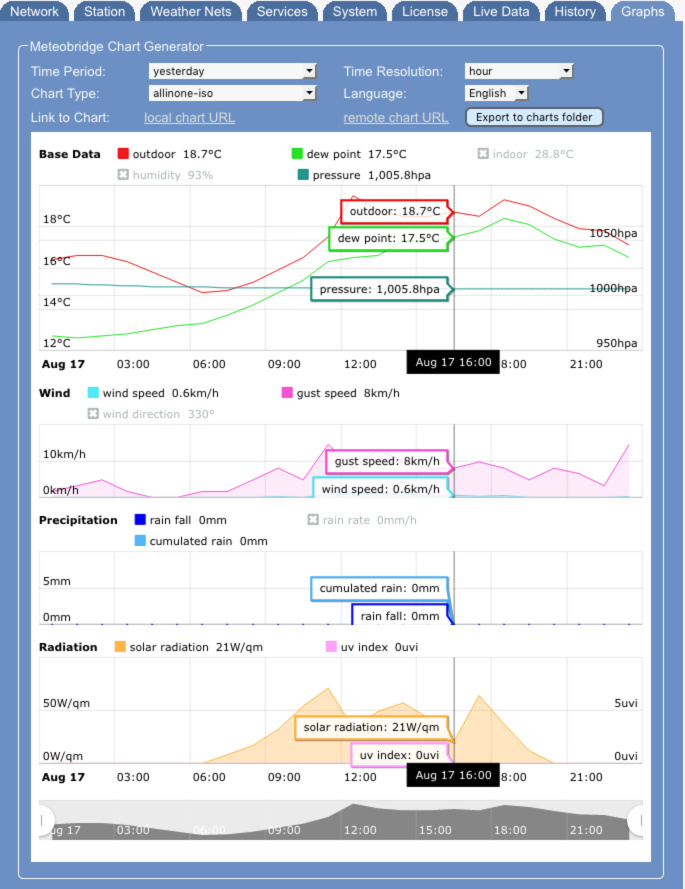
One of the features that sets Meteobridge PRO and NANO SD apart from the regular Meteobridges is the ability to generate interactive Charts. You can select one of the predefined Chart templates, select the time period you are interested in, selcts a time resolution, and the languge. Having done that, press "save" and the chart will be genertead and displayed. Meteobridge does also provide you a URL you can use locally or from the internet (when remote login is enabled) to generate the chart.
Time Period
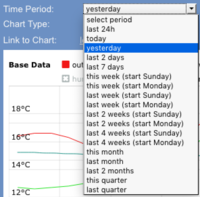
Meteobridge provides the following predefined time periods to select from:- last 24h
- today
- yesterday
- last 2 days
- last 7 weeks
- this week (start Sunday)
- this week (start Monday)
- last week (start Sunday)
- last week (start Monday)
- last 2 weeks (start Sunday)
- last 2 weeks (start Monday)
- last 4 weeks (start Sunday)
- last 4 weeks (start Monday)
- this month
- last month
- this quarter
- last quarter
URL selector
When calling a chart by an URL the time frame is controlled by the arguments "start" and "stop" which determine the interval to be displayed. "start" and "stop" can be
- a distinct time stamp in "YYYYMMDDhhmm" notation like "201901010000" for 00:00 on Jan 1, 2019. Depending on the chooses time resolution minutes and hours can be omitted.
- a relative time stamp like "Yn" (year), "Mn" (month), "Wn" (week), "Dn" (day), "Hn" (hour), where the first letter indicates the time scale (year, month, week, day, hour) and the consecutive number indicates how many steps to go into the past. Example: "M0" indicates the current month, M1 last month, M2 month before last month, etc. To show data of the current month the URL looks like "&start=M1&end=M0"

