Difference between revisions of "Show Chart"
(Created page with "__NOTOC__ ==Show Chart== Meteoplug allows to display result of applying your chart definition to your weather data. Simply select chart you want to display from drop-down men...") |
(No difference)
|
Revision as of 16:41, 9 February 2020
Show Chart
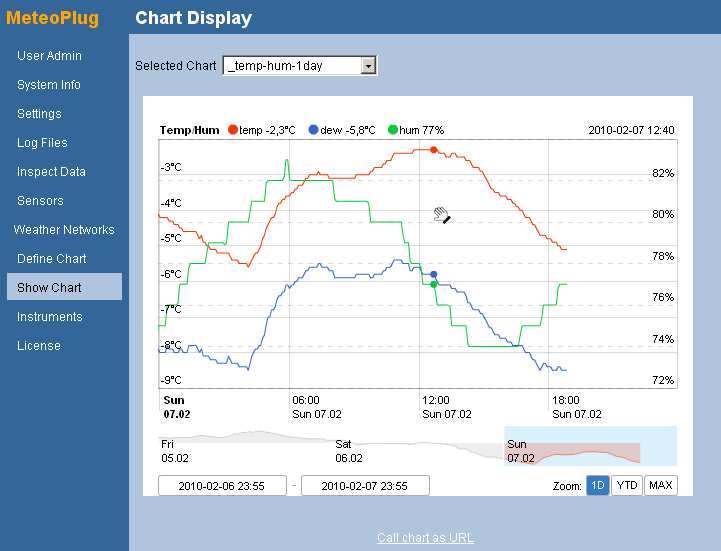
Meteoplug allows to display result of applying your chart definition to your weather data. Simply select chart you want to display from drop-down menu. The chart will immediately generated. If something goes wrong an error message will appear instead of chart.

The link at the bottom allows to access the chart as a stand alone HTML page. When you want to include the chart into your homepage, just put this link into an IFRAME section like this:
<iframe src="http://www.meteoplug.com/cgi-bin/meteochart.cgi?draw=6f686c6a6d791900065249..."
        allign="top"
        scrolling="no"
        frameborder="0"
        width="580"
        height="430">
    Browser does not support IFRAMEs
</iframe>
Using this IFRAME wrapper, the chart will be included into your home page like you can see below. Inclusion by IFRAMES is a very simply but powerful technique to bring Meteoplug content onto your web pages.
website=http://www.meteoplug.com/examples/example-4.html align=top height=430 width=580 border=0 scroll=no
</websiteFrame>The URL that "Show Chart" page of Meteoplug does give to you for external reference of the chart is valid as long as
- your Meteoplug account is active and has a valid license (or is in demo mode)
- graph definition exists and still has the same name as during generation of the link
Additional URL parameters
There are a couple of additional URL parameters you can use to change some settings of your chart definition when calling the chart for generation. These parameters have to follow the "draw" token in the URL.
You can make use of these additional URL parameters:
- timeframe: While the chart definition also defines time frame to be used for display, you can overwrite time frame defined in the chart by adding URL parameter "&timeframe=20100101000000-20100131235959" to it. In the given example this will display data for January of 2010.
- resolution: Changes the resolution gives with "res" name-value pair in the chart definition. Example: "&resolution=min10"
- client: This parameter is valid for clients attached to a Meteoplug group account. You can apply the chart definition to a client with a given name. Example: "&client=beach1"
Alternative URL
Meteoplug can generate pure graphic files (like png) when used in gnuplot or picture mode. Some data polling devices need the URL to address a ".png" or ".jpg" file. Therefore, URLs like "http://www.meteoplug.com/cgi-bin/meteochart.cgi?draw=696368686d7930264f0b100b090b5449130f0414792a343a3337" won't do, because this does not match the expected URL naming schema. For situations like this you can change the URL to "http://www.meteoplug.com/draw/696368686d7930264f0b100b090b5449130f0414792a343a3337/temp-1month.png" where the draw toke is used as a path identifier and a filename of your choice in that path. This technique was designed to generate overlay png file to be used by Mobotix webcams but might be usefull in other situations as well.
Additional URL parameters cannot be handled by this type of URL resolution.