PRO Graphs
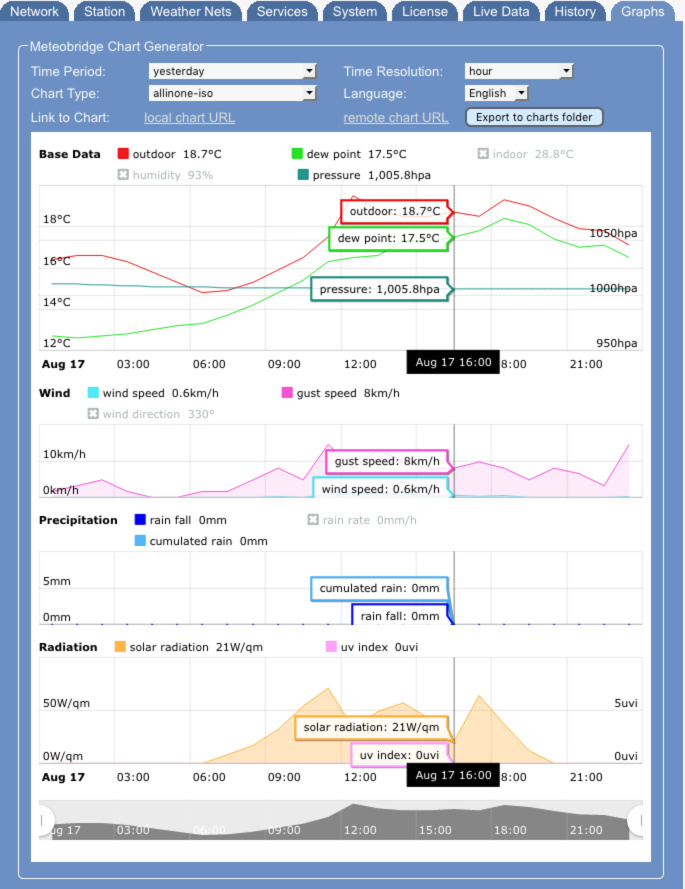
One of the features that sets Meteobridge PRO and NANO SD apart from the regular Meteobridges is the ability to generate interactive Charts. You can select one of the predefined Chart templates, select the time period you are interested in, selcts a time resolution, and the languge. Having done that, press "save" and the chart will be genertead and displayed. Meteobridge does also provide you a URL you can use locally or from the internet (when remote login is enabled) to generate the chart.
Time Period
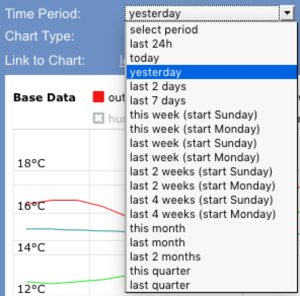
Meteobridge provides the following predefined time periods to select from:- last 24h
- today
- yesterday
- last 2 days
- last 7 weeks
- this week (start Sunday)
- this week (start Monday)
- last week (start Sunday)
- last week (start Monday)
- last 2 weeks (start Sunday)
- last 2 weeks (start Monday)
- last 4 weeks (start Sunday)
- last 4 weeks (start Monday)
- this month
- last month
- this quarter
- last quarter
URL selector
When calling a chart by an URL the time frame is controlled by the arguments "start" and "stop" which determine the interval to be displayed. "start" and "stop" can be
- a distinct time stamp in "YYYYMMDDhhmm" notation like "201901010000" for 00:00 on Jan 1, 2019. Depending on the chooses time resolution minutes and hours can be omitted.
- a relative time stamp like "Yn" (year), "Mn" (month), "Wn" (week), "Dn" (day), "Hn" (hour), where the first letter indicates the time scale (year, month, week, day, hour) and the consecutive number indicates how many steps to go into the past. Example: "M0" indicates the current month, M1 last month, M2 month before last month, etc. To show data of the current month the URL looks like "&start=M1&end=M0"
Chart Type
Meteobridge has a number of charts predefined. You can simply select those with the drop-down menu. The charts are located on the internal storage and can be access as a PC network drive in forder "templates". All charts have extension ".chart" or ".metachart". While ".chart" definitions are hand-crafted the ".metachart" files just contain some definitions which are used to build an individual chart when called. When you want to build charts yourself, please create ".metachart" files.
Meta Chart Definition
A meta chart is a simple text file with extension ".metachart" located in "templates" folder. Lines with a preceding "#" are viewed as comments and are not evaluated. Each non-comment line in the file represents a name-value pair. first word in a line is the name, following words until end of the line are handled as the value corresponding to the name. These names are defined:
- title defines the name of the chart. Example "title Temperature" sets "Temperature" as the chart title.
- lang defined the language for the chart ("en" is default). Example: "lang de" defines German as the chart language.
- futuredata expands the chart into the future if set to "yes" (default). If set to "no" chart will stop at current date/time.
- chart defines the type of the chart. Currently only "line" (default) is supported.
- dataX defines data set "X". "X" should start at 1 and needs to be incremented for each new data set to be used in the chart. Data sets are sensor names as used in template expansions like "th0temp-avg.1" which represents outdoor temperature (th0 sensor) averaged on the chosen resolution and with one decimal precision. Examples: "rain0total-daysum=in.2" represents the cumulated rain fall (rain0 sensor) per day in inch with 2 decimals precision. "rain0total-sum.1" represents the cumulated rainfall in mm over the total selected time period in 1 decimal precision.
nameX gives dataset X a name to be used in the chart. axisX defines if data set X is measured on the "left" (default) or "right" vertical axis. Instead of "left" or "right" there can also be given a reference to an already defined axis which inhibits that the scale in the vertical axis is duplicated. Example "axis3 axis1" tells that data set 3 uses the same vertical axis as data set 1. unitX defines the unit string to be used for dataset X in the chart. Example: "unit1 °C" defines data set 1 is annotated as °C in the chart. colorX defines the color to be used for data set X in the chart. Example: "color2 #000000" defines black color for data set 2. If no color is selected Mateobridge uses one of eight default colors. activeX defines if the data set X is shown when displaying the chart. If set to "no" it needs a click to the data set in the chart to make it visible. Default is "yes". legendX defined which data set to be used as reference in the time line of the chart. Default is data set 1. minX, maxX, offsetX define the minimum, maximum and offset value for vertical axis representation of data set X.
Example of a meta chart that displays outdoor temp, humidity, dew point and sea level pressure. Dew point and sea level pressure are disabled Temperature and Dew point share the same vertical axis (axis1), humidity axis is scaled from 0 to 100
Time Resolution
Meteobridge provides data in yearly, monhtly, daily, hourly, and for the last 3 days also in per minute resolution. You can select the desired resolution per drop-down menu.
Language
Charts can be made in different languages. This has an effect on the ".charts" as it makes use of the language specific names for the sensors and it also has an impact on the time line. These languages are available:
- English
- German
- Dutch
- French
- Italian
- Spanish
External Use
To make external use of a defined chart Meteobridge provides a local and a remote link. This link contains all the made choice as URL parameters. Example: The chart shown on the top of the page can be directly accessed by the URL "http://ip-of-your-meteohub/public/chart.cgi?chart=allinone-iso.chart&res=hour&lang=en&start=D2&stop=D1"

